Olá pessoal,
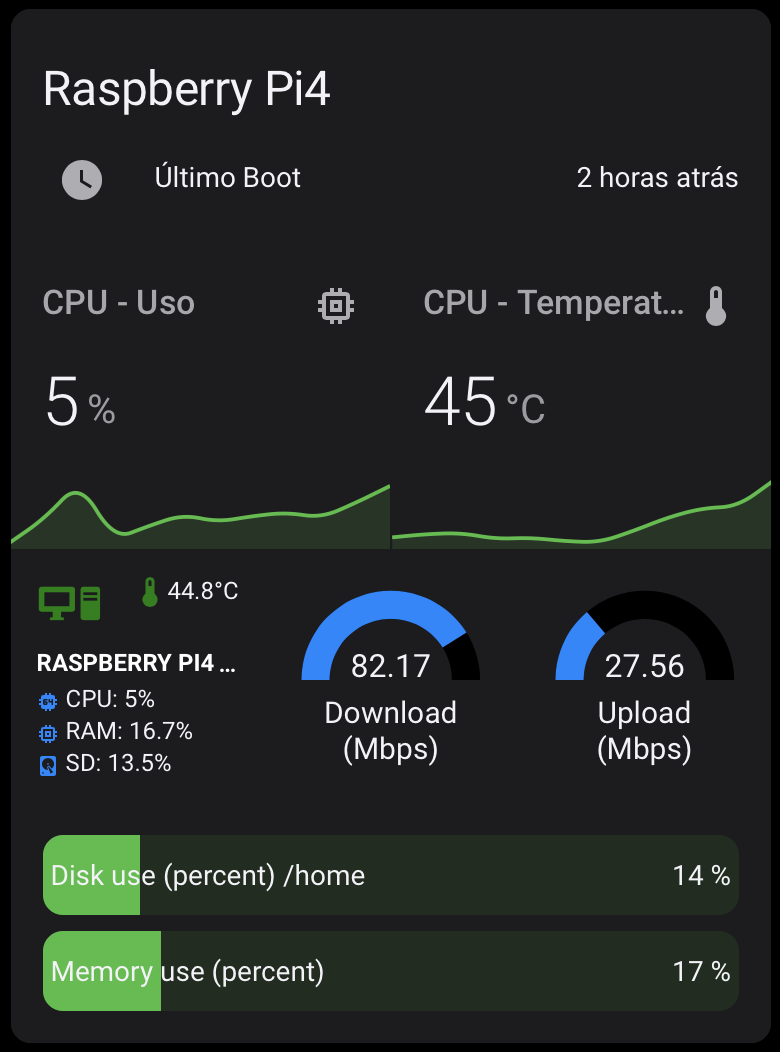
Neste tutorial, vou ensinar vocês a criarem os sensores para monitorar o seu Raspberry e também como configurar o card na interface do seu Lovelace.
Sigam estes passos:
-
Instalar o HACS
-
Instalar os addons de Frontend através do HACS
Mini Graph Card
horizontal-stack
button-card
Bar Card
Stack In Card -
Adicionar os códigos abaixo (configuration e lovelace)
Adicionar o sensor do SpeedTest no /config/configuration.yaml:
# SPEED TEST
speedtestdotnet:
  scan_interval:
    minutes: 60
Adicionar ao /config/configuration.yaml na seção “sensor”:
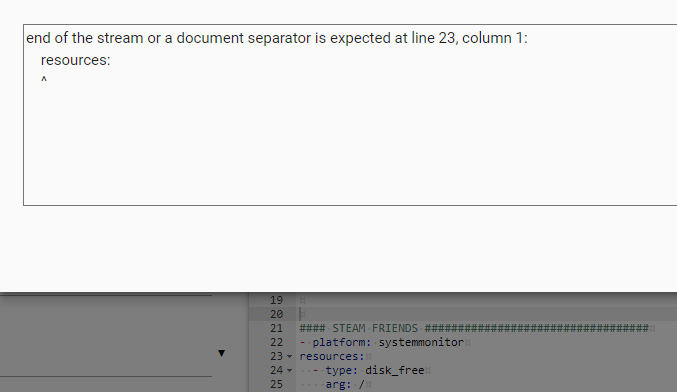
- platform: systemmonitor
resources:
  - type: disk_free
    arg: /
  - type: disk_use
    arg: /
  - type: disk_use_percent
    arg: /home
  - type: memory_free
  - type: memory_use
  - type: memory_use_percent
  - type: processor_use
  - type: last_boot
  - type: swap_use_percent
  - type: swap_use
  - type: swap_free
  - type: throughput_network_in
    arg: eth0
  - type: throughput_network_out
    arg: eth0
  - type: network_in
    arg: 'Local Area Connection'
  - type: network_in
    arg: eth0
  - type: network_out
    arg: eth0
  - type: ipv4_address
    arg: eth0
  - type: packets_in
    arg: eth0
  - type: packets_out
    arg: eth0
  - type: process
    arg: octave-cli
  - type: load_1m
  - type: load_5m
  - type: load_15m

- platform: command_line
name: HA Start
#icon: mdi:lastpass
command: grep -m1 'Home Assistant initialized' home-assistant.log | awk '{ print $6, $7, $8, $9, $10 }'

- platform: command_line
name: CPU Temperature
command: "cat /sys/class/thermal/thermal_zone0/temp"
unit_of_measurement: "°C"
value_template: '{{ value | multiply(0.001) | round(1) }}'

- platform: dnsip

- platform: uptime
name: Time Online
unit_of_measurement: hours
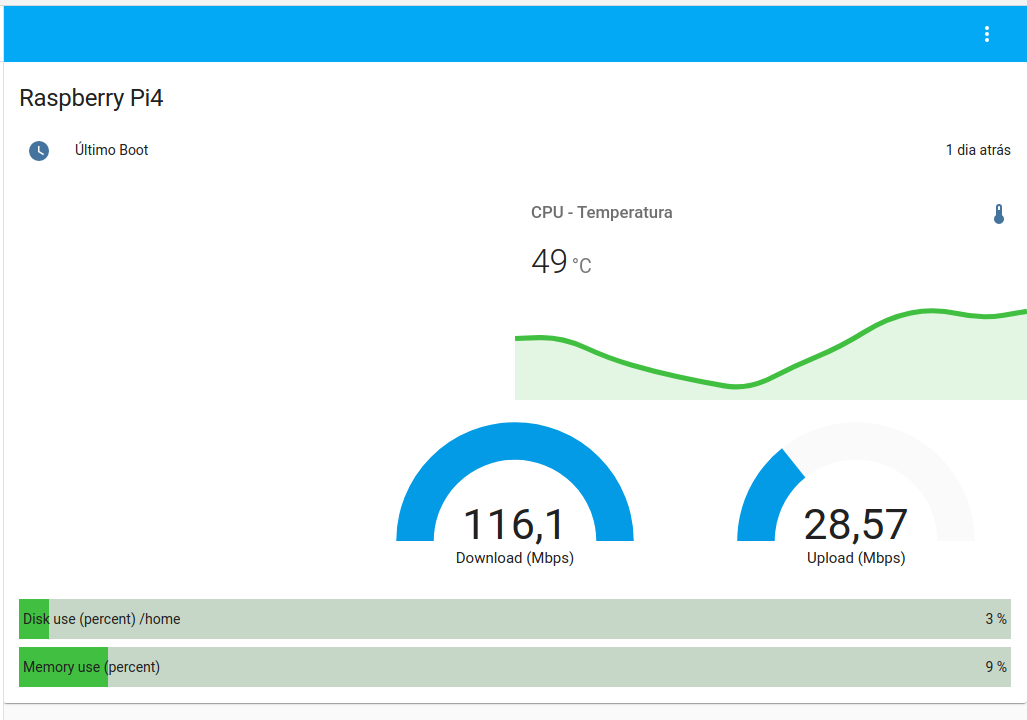
Adicione isso ao seu Lovelace (dentro de uma view):
- cards:
- entities:
- entity: sensor.last_boot
icon: 'mdi:clock'
name: Último Boot
show_header_toggle: false
title: Raspberry Pi4
type: entities
- cards:
- color_thresholds:
- color: '#bf4040'
from: 50
to: 100
- color: '#ffde00'
from: 10
to: 49
- color: '#40bf40'
from: 0
to: 9
entities:
- entity: sensor.processor_use
index: 0
name: CPU - Uso
icon: 'mdi:memory'
type: 'custom:mini-graph-card'
- color_thresholds:
- color: '#bf4040'
from: 56
to: 100
- color: '#ffde00'
from: 51
to: 55
- color: '#40bf40'
from: 0
to: 50
decimals: 0
entities:
- entity: sensor.cpu_temperature
index: 0
name: CPU - Temperatura
type: 'custom:mini-graph-card'
type: horizontal-stack
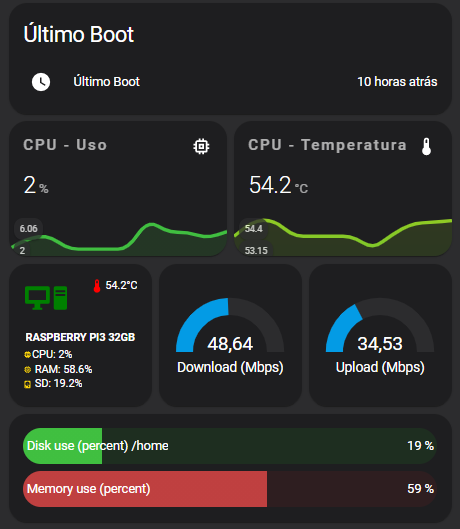
- cards:
- aspect_ratio: 1/1
custom_fields:
cpu: |
[[[
return `<ha-icon
icon="mdi:cpu-64-bit"
style="width: 12px; height: 12px; color: var(--paper-item-icon-active-color);">
</ha-icon><span> CPU: <span style="color: var(--text-color-sensor);">${states['sensor.processor_use'].state}%</span></span>`
]]]
ram: |
[[[
return `<ha-icon
icon="mdi:memory"
style="width: 12px; height: 12px; color: var(--paper-item-icon-active-color);">
</ha-icon><span> RAM: <span style="color: var(--text-color-sensor);">${states['sensor.memory_use_percent'].state}%</span></span>`
]]]
ssd: |
[[[
return `<ha-icon
icon="mdi:harddisk"
style="width: 12px; height: 12px; color: var(--paper-item-icon-active-color);">
</ha-icon><span> SD: <span style="color: var(--text-color-sensor);">${states['sensor.disk_use_percent_home'].state}%</span></span>`
]]]
temp: |
[[[
return `<ha-icon
icon="mdi:thermometer"
style="width: 18px; height: 18px; color: var(--text-color-sensor);">
</ha-icon><span>${entity.state}°C</span>`
]]]
entity: sensor.cpu_temperature
icon: 'mdi:desktop-tower-monitor'
name: Raspberry Pi4 4gb
styles:
card:
- padding: 10%
- font-size: 12px
- text-shadow: 0px 0px 0px black
- text-transform: uppercase
- font-variant: small-caps
custom_fields:
cpu:
- padding-bottom: 2px
- align-self: middle
- justify-self: start
- '--text-color-sensor': >-
[[[ if (states["sensor.processor_use"].state > 5)
return "red"; ]]]
ram:
- padding-bottom: 2px
- align-self: middle
- justify-self: start
- '--text-color-sensor': >-
[[[ if (states["sensor.memory_use_percent"].state >
80) return "red"; ]]]
ssd:
- align-self: middle
- justify-self: start
- '--text-color-sensor': >-
[[[ if (states["sensor.disk_use_percent_home"].state >
80) return "red"; ]]]
temp:
- align-self: start
- justify-self: end
- '--text-color-sensor': >
[[[ if (entity.state < 50) return 'green'; if
(entity.state >= 60 && entity.state < 80) return
'orange'; else return 'red'; ]]]
grid:
- grid-template-areas: '"i temp" "n n" "cpu cpu" "ram ram" "ssd ssd"'
icon:
- color: |
[[[
if (entity.state < 50) return 'green';
if (entity.state >= 60 && entity.state < 80) return 'orange';
else return 'red';
]]]
- width: 70%
- margin-top: '-10%'
img_cell:
- justify-content: start
- align-items: start
- margin: none
name:
- font-weight: bold
- font-size: 12px
- color: white
- padding-bottom: 4px
tap_action:
action: navigate
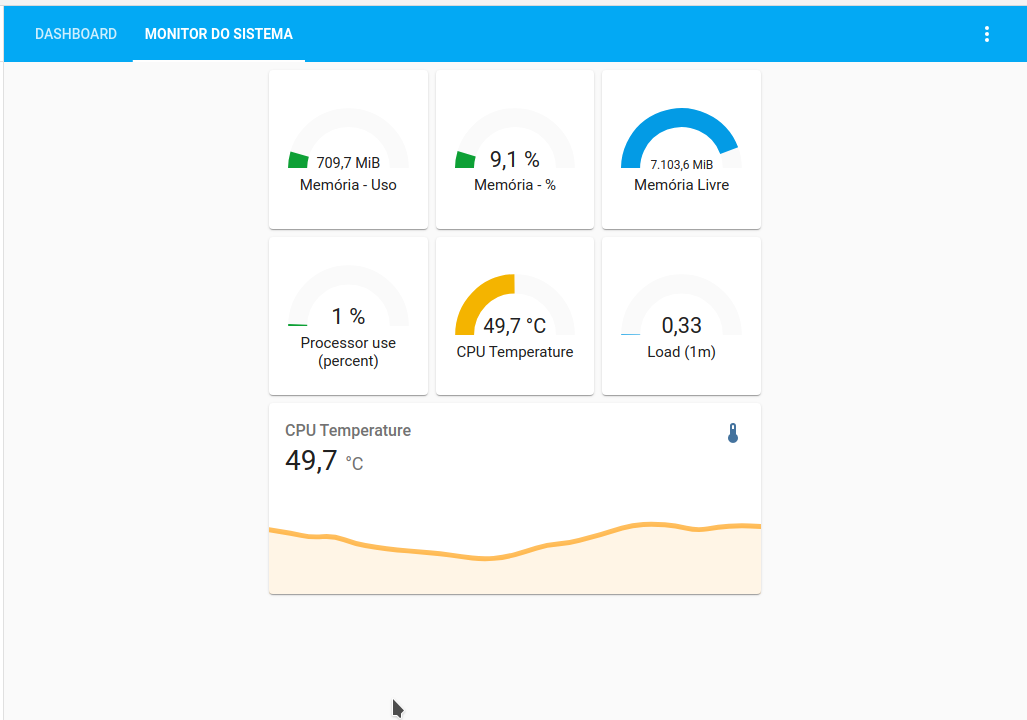
navigation_path: '#system'
type: 'custom:button-card'
- entity: sensor.speedtest_download
name: Download (Mbps)
type: gauge
unit: ' '
- entity: sensor.speedtest_upload
name: Upload (Mbps)
type: gauge
unit: ' '
type: horizontal-stack
- align: split
animation: auto
attribute: false
card_style: false
charge_entity: false
columns: 1
decimal: 0
delay: 5000
direction: right
entities:
- entity: sensor.disk_use_percent_home
icon: 'mdi:harddisk'
severity:
- color: '#40bf40'
value: 10
- color: '#ffde00'
value: 50
- color: '#bf4040'
value: 100
title: HDD
- entity: sensor.memory_use_percent
icon: 'mdi:memory'
severity:
- color: '#40bf40'
value: 0
- color: '#ffde00'
value: 50
- color: '#bf4040'
value: 100
title: RAM
entity_config: true
height: 40px
icon: false
icon_position: 'off'
icon_style:
filter: none
height: 34px
width: 34px
indicator: auto
limit_value: false
max: 100
min: 0
minmax_style: false
padding: 5px
positions:
icon: 'off'
indicator: 'off'
title: outside
rounding: 5px
saturation: 50%
severity:
- color: '#bf4040'
from: 50
to: 100
- color: '#ffde00'
from: 20
to: 49
- color: '#40bf40'
from: 0
to: 19
show_icon: true
show_minmax: false
show_value: true
speed: 1000
style: |-
bar-card-current, bar-card-backgroundbar {
border-radius: 20px;
}
bar-card-value {
margin-right: auto;
}
tap_action: info
target: false
title: false
title_position: inside
title_style:
color: '#00000'
font-weight: normal
text-shadow: none
type: 'custom:bar-card'
unit_of_measurement: false
value_style:
color: '#00000'
font-size: 18px
font-weight: normal
text-shadow: none
visibility: false
width: 100%
type: 'custom:vertical-stack-in-card'