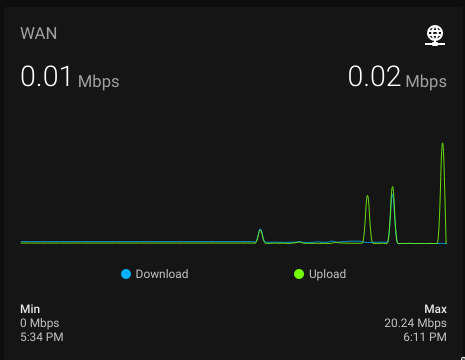
Com esse sensor será capaz de ver quase em tempo real o consumo da sua conexã.
Para obter o tráfego via snmp primeiramente você precisa ativar o SNMP em seu roteador e saber qual OID terá os dados in/out. No meu exemplo vou explicar como obter esses dados de um RouterOS/Mikrotik, mas com o snmpwalk vc pode descobrir o OID de seu router.
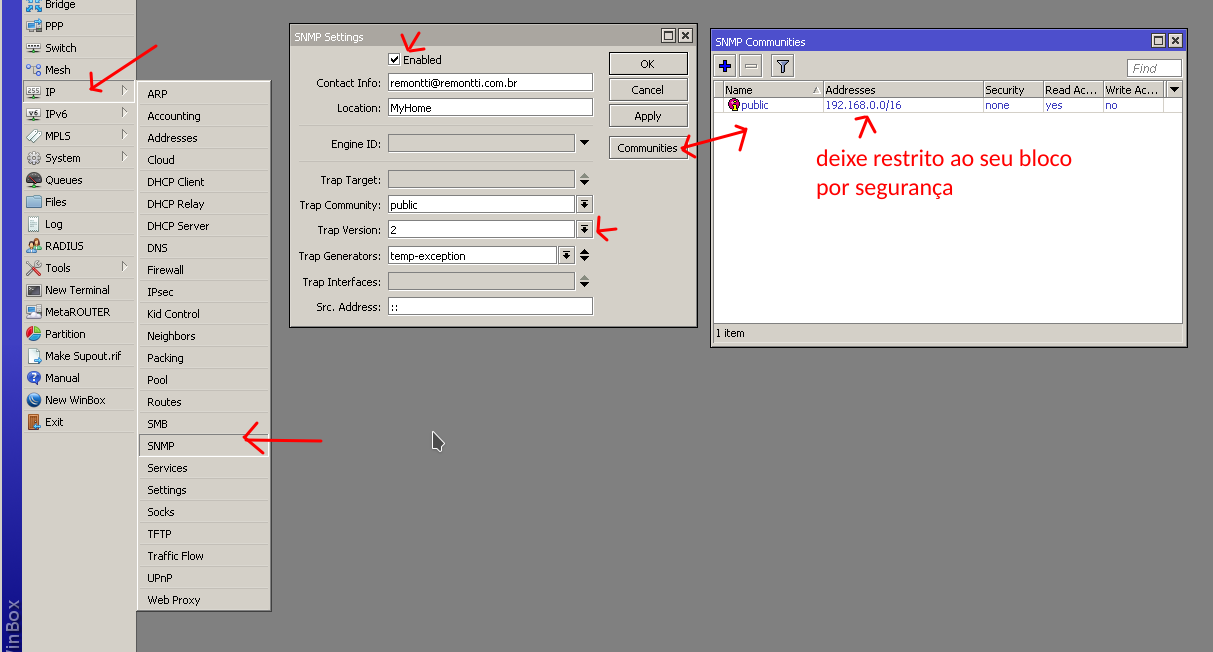
Por linha de comnado:
/snmp community
set [ find default=yes ] addresses=192.168.0.0/16
/snmp
set [email protected] enabled=yes location=MyHome trap-version=2
Crie os sensores:
sensor:
  - platform: snmp
    name: 'ether1_wan_in'
    host: 192.168.10.1
    baseoid: 1.3.6.1.2.1.31.1.1.1.6.1
    community: 'public'
    version: '2c'
  - platform: snmp
    name: 'ether1_wan_out'
    host: 192.168.10.1
    baseoid: 1.3.6.1.2.1.31.1.1.1.10.1
    community: 'public'
    version: '2c'

  - platform: template
    sensors:
      internet_speed_in:
        friendly_name: 'Download'
        value_template: '{{ ((states.input_number.internet_delta_in.state | float ) / 1000000 ) | round(2) }}'
        unit_of_measurement: 'Mbps'
        icon_template: 'mdi:download-network'
      internet_speed_out:
        friendly_name: 'Upload'
        value_template: '{{ ((states.input_number.internet_delta_out.state | float ) / 1000000 ) | round(2) }}'
        unit_of_measurement: 'Mbps'
        icon_template: 'mdi:upload-network'

  - platform: statistics
    name: 'WAN In'
    entity_id: sensor.internet_speed_in
    max_age:
      hours: 12
  - platform: statistics
    name: 'WAN Out'
    entity_id: sensor.internet_speed_out
    max_age:
      hours: 12
OID Down/UP do Router OS
1.3.6.1.2.1.31.1.1.1.10.1 --> ether1 out
1.3.6.1.2.1.31.1.1.1.6.1 --> ether1 in
1.3.6.1.2.1.31.1.1.1.10.2 --> ether2 Out
1.3.6.1.2.1.31.1.1.1.6.2 --> ether2 in
…
Adicione dois input number para poder fazer o cálculo delta:
input_number:
  internet_delta_in:
    initial: 0
    min: 0
    max: 1000000000000
    mode: slider
  internet_delta_out:
    initial: 0
    min: 0
    max: 1000000000000
    mode: slider
Em sua automação faremos ela atualizar nosso input_number
automation:
  - alias: "Monitor WAN in"
    trigger:
      platform: state
      entity_id: sensor.ether1_wan_in
    action:
      - service: input_number.set_value
        data_template:
          entity_id: input_number.internet_delta_in
          value: '{{ ((trigger.to_state.state | int - trigger.from_state.state | int) * 8 ) / ( as_timestamp(trigger.to_state.last_updated) - as_timestamp(trigger.from_state.last_updated) ) }}'
  - alias: "Monitor WAN out"
    trigger:
      platform: state
      entity_id: sensor.ether1_wan_out
    action:
      - service: input_number.set_value
        data_template:
          entity_id: input_number.internet_delta_out
          value: '{{ ((trigger.to_state.state | int - trigger.from_state.state | int) * 8 ) / ( as_timestamp(trigger.to_state.last_updated) - as_timestamp(trigger.from_state.last_updated) ) }}'
Restart seu HA
Agora vamos ter diversos sensores (debug)
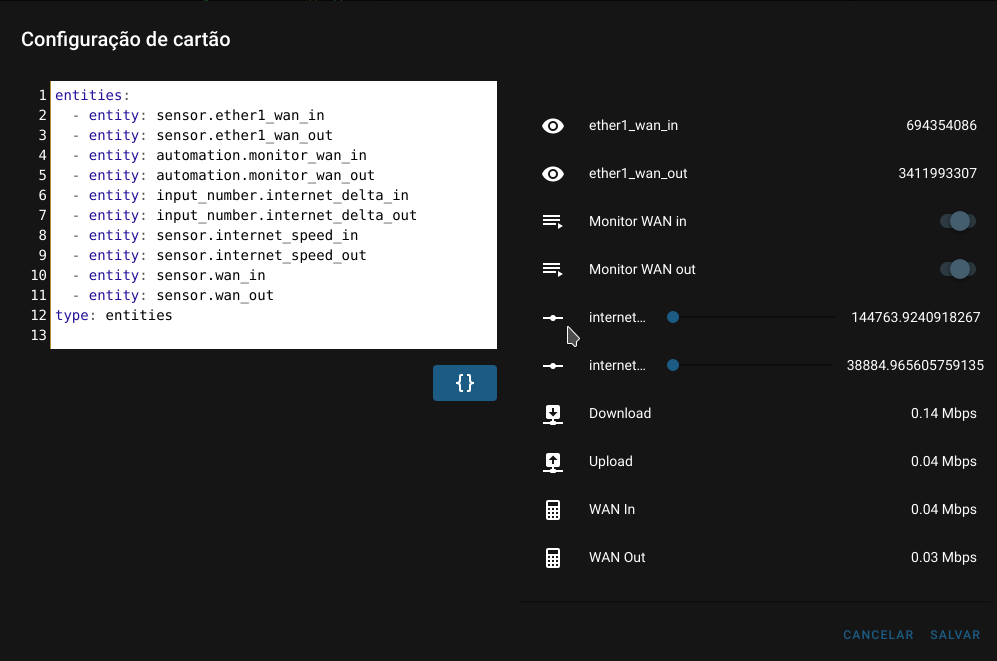
entities:
  - entity: sensor.ether1_wan_in
  - entity: sensor.ether1_wan_out
  - entity: automation.monitor_wan_in
  - entity: automation.monitor_wan_out
  - entity: input_number.internet_delta_in
  - entity: input_number.internet_delta_out
  - entity: sensor.internet_speed_in
  - entity: sensor.internet_speed_out
  - entity: sensor.wan_in
  - entity: sensor.wan_out
type: entities
Agora é so se divertir nos cars 
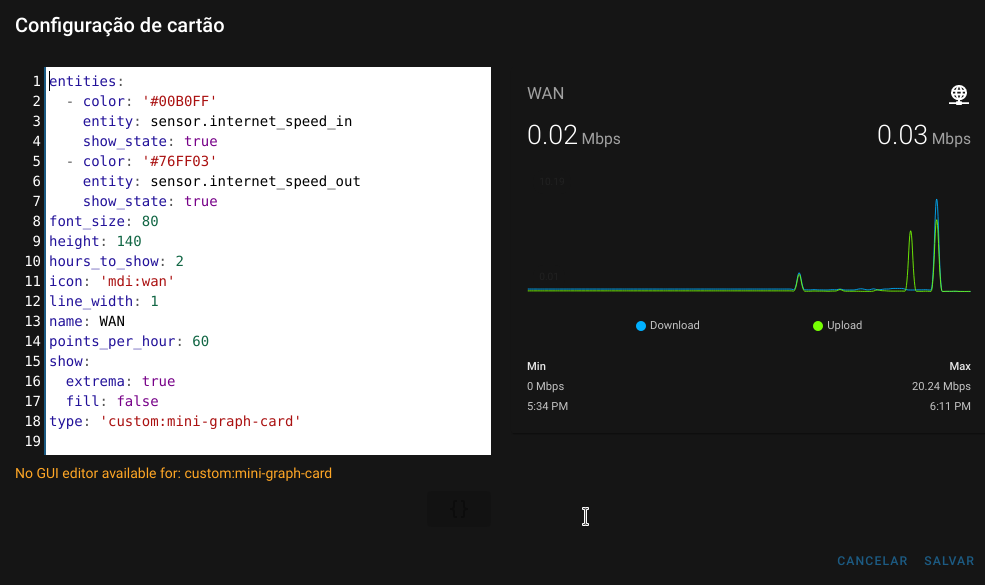
entities:
  - color: '#00B0FF'
    entity: sensor.internet_speed_in
    show_state: true
  - color: '#76FF03'
    entity: sensor.internet_speed_out
    show_state: true
font_size: 80
height: 140
hours_to_show: 2
icon: 'mdi:wan'
line_width: 1
name: WAN
points_per_hour: 60
show:
  extrema: true
  fill: false
type: 'custom:mini-graph-card'

cards:
  - cards:
      - entity: sensor.internet_speed_in
        name: Down
        type: gauge
        unit: ' '
        severity:
          green: 0
          yellow: 10
          red: 20
      - entity: sensor.internet_speed_out
        name: Up
        type: gauge
        unit: ' '
        severity:
          green: 0
          yellow: 2.5
          red: 5
    type: horizontal-stack
type: vertical-stack